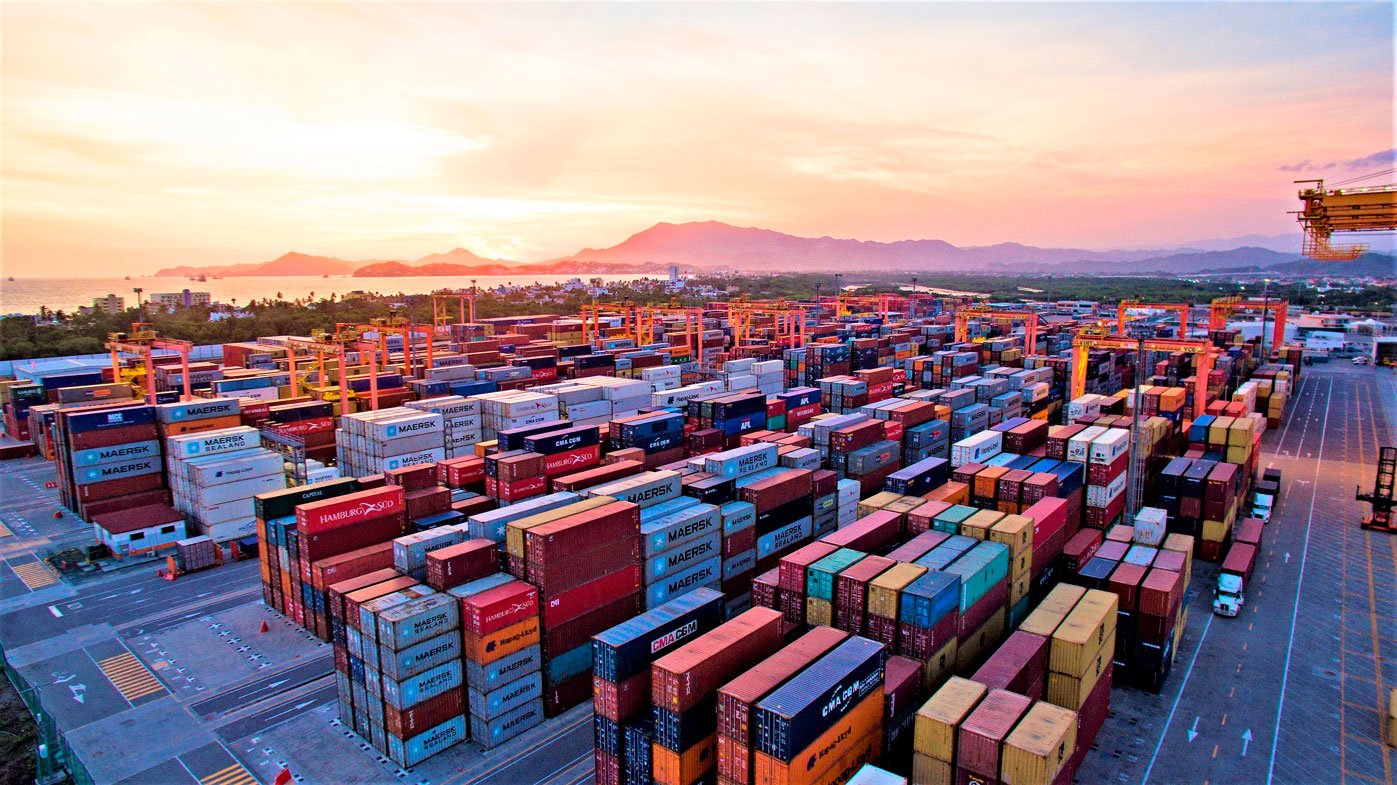
Merchandise Trade Balance
In April 2026, preliminary foreign trade data showed a trade surplus
of US$4.52 billion. This surplus compares to the US$5.932 billion surplus reported
in March. The decrease in the trade surplus between March and April
originated from a reduction in the non-oil trade surplus—which fell
from US$8.32 billion in March to US$7.216 billion in April—and a larger deficit in the oil trade balance—which increased from US$2.388 billion to US$2.696 billion during the same period.
For the first four months of 2026, the trade balance showed a surplus of
US$3.508 billion. In the same period of 2025, it reported a deficit of US$314 million.
Total Merchandise Exports
In the fourth month of this year, the value of merchandise exports was US$72,042 million, an amount 32.6% higher than in the same month of 2025. This increase resulted from a 33.5% rise in non-oil exports and a 7.9% rise in oil exports.
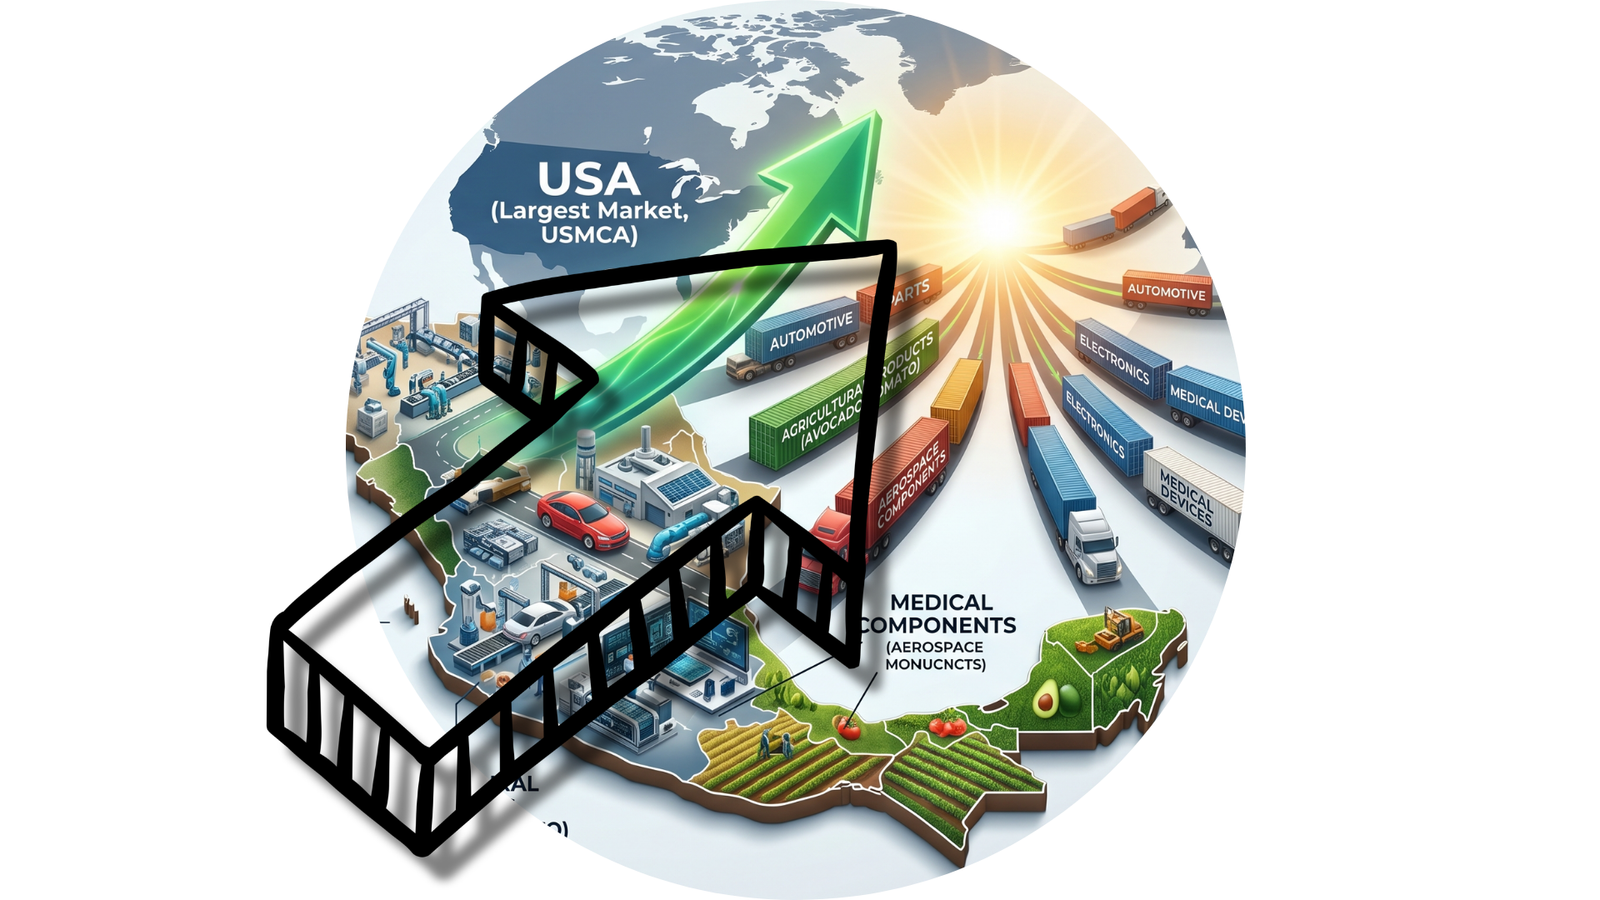
Within non-oil exports, those destined for the United States increased 34.8% year-on-year, while those destined for the rest of the world increased by 26.7%.
Exports by Type of Goods
In April 2026, the value of manufactured goods exports was US$65,687 million, representing a 34.0% year-on-year increase. The largest increases were observed in exports of mining and metallurgical products (42.5%), food, beverages, and tobacco (16.8%), electrical and electronic equipment and appliances (15.9%), and automotive products (8.2%). The year-on-year increase in automotive product exports stemmed from a 5.8% rise in sales to the United States and a 22.5% increase in sales to other markets.
In the reference month, the value of petroleum exports was US$2,047 million.
This amount consisted of $1.363 billion in crude oil sales and $684 million in exports of other petroleum products. In that month, the average price of the Mexican crude oil export mix was $94.99 per barrel, $10.89 higher than the previous month and $33.98 higher than in April 2025. The level of crude oil exported was 478,000 barrels per day, lower than the 495,000 barrels per day of March 2026 and the 726,000 barrels per day of April 2025. In the fourth month of 2026, the value of agricultural and fisheries exports was $2.23 billion, a level similar to that of the same month in 2025 (annual variation of 0.1%). The largest annual increases were recorded in exports of melon, watermelon, and papaya (73.2%), citrus fruits (55.8%), edible fruits and nuts (32.9%), tomatoes (24.3%), and fresh vegetables and legumes (15.9%). In contrast, the most significant annual decreases were seen in exports of fresh strawberries (56.5%) and avocados (28.8%). Extractive exports totaled US$2,078 million, representing a 71.0 percent year-on-year increase.
MEXICO'S MERCHANDISE TRADE BALANCE (MCB)
In the period January-April 2026, the value of total exports reached US$247,628 million, representing an annual growth of 21.8 percent. This rate resulted from a 23.4 percent increase in non-oil exports and a 17.2 percent decrease in oil exports.
Export Structure
In the first four months of 2026, the structure of the value of merchandise exports was as follows: manufactured goods, 91.1 percent; agricultural goods, 3.3 percent; non-oil extractive products, 3.0 percent; and oil products, 2.6 percent.
Total Merchandise Imports
In April 2026, the value of merchandise imports was US$67,522 million, representing a year-on-year increase of 24.1 percent.
Imports by Type of Good
In the reference month, consumer goods imports reached US$8,499 million, a year-on-year increase of 7.7 percent. This rate resulted from an 11.0 percent increase in non-petroleum consumer goods imports and a 5.3 percent decrease in petroleum consumer goods imports (gasoline and butane and propane gas).
Imports of intermediate goods totaled US$54.228 billion, 29.8% higher than the figure reported in April 2025. This increase resulted from a 31.9% rise in imports of non-oil intermediate goods and a 3.8% increase in imports of oil intermediate goods.
Meanwhile, imports of capital goods reached US$4.794 billion, representing a 1.3% year-on-year increase.
In the first four months of 2026, the cumulative value of total imports was US$244.120 billion, 19.9% higher than the same period in 2025. Within this total, non-oil imports rose 21.5% and oil imports increased 1.1% year-on-year.
Import Structure
During the period January-April 2026, the structure of the value of imports was as follows: intermediate goods, 79.9%; consumer goods, 12.7%; and capital goods, 7.4%.
II. SEASONALLY ADJUSTED FIGURES
In April 2026, using seasonally adjusted figures, the trade balance registered a surplus
of US$3,351 million, compared to US$2,186 million in March. The expansion of the
surplus, between March and April, resulted from a larger surplus in the non-oil trade balance —which went from $4.735 billion in March to $5.952 billion in April— and an increase in the oil trade balance deficit —which went from $2.550 billion to $2.601 billion in the same comparison—.
In the month under review, in seasonally adjusted terms, total exports registered a monthly increase of 5.12 percent. This resulted from a 4.77% rise in non-oil exports and an 18.40% increase in oil exports. Within non-oil exports, manufacturing exports showed a monthly increase of 4.69 percent. This rate resulted from growth of 0.94% in automotive exports and 6.06% in non-automotive manufacturing exports. In the month under review, in seasonally adjusted terms, total exports registered a monthly increase of 5.12 percent. This resulted from a 4.77% rise in non-oil exports and an 18.40% increase in oil exports. Within non-oil exports, manufacturing exports showed a monthly increase of 4.69 percent. This rate resulted from growth of 0.94% in automotive exports and 6.06% in non-automotive manufactured goods.